Posts

Explore Currency Pairs with vfxAlert!

Image
  In trading, understanding currency pairs is key. They are like the building blocks of trading, especially in forex and cryptocurrency. Today, we'll make it simple and clear what currency pairs are all about, and we'll see the many options available on vfxAlert. What Are Currency Pairs? Currency pairs are pairs of money. They show how one type of money compares to another. Each pair has two currencies: one is called the "base currency," and the other is the "quote currency." The pair's rate tells us how much of the quote currency it takes to buy one unit of the base currency. For example, if the EUR/USD pair is at 1.20, it means you need 1.20 US dollars to get one Euro. Now, let's check out the different currency pairs you can trade on vfxAlert : Forex Pairs:  EUR/USD: Euro vs. US Dollar USD/JPY: US Dollar vs. Japanese Yen EUR/GBP: Euro vs. British Pound EUR/JPY: Euro vs. Japanese Yen AUD/USD: Australian Dollar vs. US Dollar GBP/USD: British Pound v...

Bulls&Bears

Image
  Similar to any other industry, trading in financial markets comes with its own unique jargon, and among its most renowned figures are the "bulls" and "bears." These two groups play pivotal roles in influencing price fluctuations across all exchanges and assets.  Bulls&Bears Indicator is a popular tool used in trading to assess market sentiment. Traders use this Indicator to understand market direction, identify entry and exit points, and manage risk effectively.  In the vfxAlert application , it is displayed on the dashboard as a color scale. The more colored points are on a certain part, the stronger are the corresponding market participants. Find out how to interpret the Bulls&Bears Indicator in this article  The indicator utilizes various factors, such as price movements, volume, and market momentum, to calculate the balance between bullish and bearish sentiment.  Bulls are traders who make profit as a result of the growth in the price of a curre...

UP TO 50% DISCOUNT!

Image
  Enjoy an amazing UP TO  50% DISCOUNT for vfxAlert signals!  Test Pro licenses - 45% OFF  Basic Pro licenses -  50% OFF  To get discount : 1. Sign up at vfxalert 2. Go to the link 3. Make a payment any convenient method  Don't miss out on this fantastic offer for PRO vfxAlert until October 10th! Hurry, click here to grab your discounted Pro license !

The RSI indicator

Image
  The RSI indicator helps traders assess the strength of a financial instrument's price movement and identify potential overbought or oversold conditions. You can find the RSI indicator on the vfxAlert dashboard. When the RSI is above 70, the instrument is considered overbought, indicating a possible downward correction. On the other hand, an RSI below 30 indicates an oversold condition and a potential upward correction. When the RSI and price movement show conflicting patterns, it could be an early sign of a trend reversal. Bullish divergence occurs when the price makes lower lows, but the RSI makes higher lows, indicating potential upward momentum. Bearish divergence is reverse condition.  The RSI can help confirm the strength of a trend. During a strong uptrend, the RSI tends to stay in the overbought region, while during a strong downtrend, it lingers in the oversold region. More information about RSI in our article . If you have any questions please write to support@vfxal...

The Summary indicator

Image
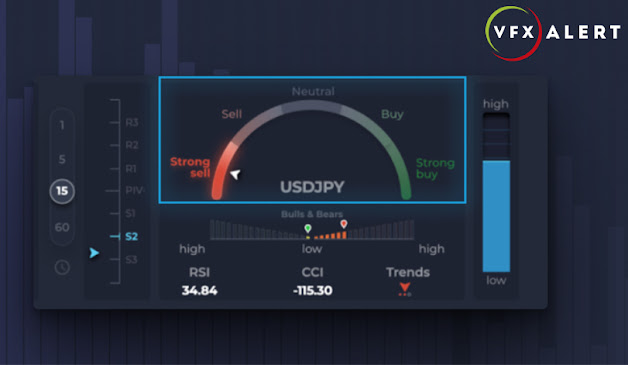
  Summary indicator is a market sentiment indicator represented on a scale generated based on indicators such as EMA on different periods, RSI, and CCI. Summary indicator is located on the vfxAlert dashboard .  Here's how to interpret the signals provided by the Summary indicator: 0- 3: Indicate a Sell. A value of 0 represents the Strong Sell, while 3 represents the weakest Sell. 4 - 6: Indicate a Neutral. A value of 4 suggests that the trend might transition to a Sell, while a value of 6 suggests a transition to a Buy. 7 -10: indicate a Buy. A value of 7 represents the weakest Buy, while 10 represents the Strong Buy. More info at the link If you have any further questions or require additional assistance, please write to support@vfxalert.com

How to interpret trend indicator in vfxAlert auto trade settings

Image
Trend indicator predicts the market's likely direction for the next 10-15 bars based on the chosen timeframe. The Trend indicator of the vfxAlert will help you quickly assess the situation and find the moment for an option. How to trade with Trend read in vfxAlert blog . Here's how to interpret the vfxAlert signals provided by the Trend indicator: Green upward arrow: Indicates an upcoming uptrend. Red downward arrow: Indicates an upcoming downtrend. Yellow arrow pointing to the right: Suggests a sideways trend. A sideways trend is the horizontal price movement that occurs when the forces of supply and demand are nearly equal. Colored dots below the arrow represent the strength of the current trend. For auto trade settings indicator values range from 0 to 10 and have the following interpretations: 0 -3: Signify a downtrend. A value of 0 represents the strongest downtrend, while 3 represents the weakest. 4-6: Indicate a sideways trend. A value of 4 suggests a potential transiti...

Auto Trade with vfxAlert

Image
Take advantage of vfxAlert auto trade   24/7:   Optimize your strategies by using algorithmic systems to achieve consistent results.  Monitor markets 24/7, reacting swiftly to opportunities.  Backtest your strategies with historical data to fine-tune and optimize their performance. Make use of automation to stay competitive and improve your trading performance. In our Telegram , you'll discover trading strategies designed for auto trade. !! Auto trade is only available for users who have connected with the broker via the vfxAlert application. !! Auto trade is only available for Ultimate Pro. Detailed Pro license terms can be found on vfxAlert official website. If you need any assistance with using the auto trade feature, feel free to reach out to us via email at support@vfxalert.com .