Posts

Showing posts from September, 2023

The RSI indicator

Image
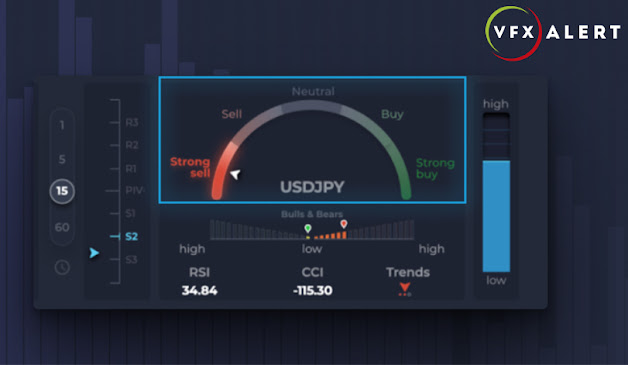
  The RSI indicator helps traders assess the strength of a financial instrument's price movement and identify potential overbought or oversold conditions. You can find the RSI indicator on the vfxAlert dashboard. When the RSI is above 70, the instrument is considered overbought, indicating a possible downward correction. On the other hand, an RSI below 30 indicates an oversold condition and a potential upward correction. When the RSI and price movement show conflicting patterns, it could be an early sign of a trend reversal. Bullish divergence occurs when the price makes lower lows, but the RSI makes higher lows, indicating potential upward momentum. Bearish divergence is reverse condition.  The RSI can help confirm the strength of a trend. During a strong uptrend, the RSI tends to stay in the overbought region, while during a strong downtrend, it lingers in the oversold region. More information about RSI in our article . If you have any questions please write to support@vfxalert.c

The Summary indicator

Image
  Summary indicator is a market sentiment indicator represented on a scale generated based on indicators such as EMA on different periods, RSI, and CCI. Summary indicator is located on the vfxAlert dashboard .  Here's how to interpret the signals provided by the Summary indicator: 0- 3: Indicate a Sell. A value of 0 represents the Strong Sell, while 3 represents the weakest Sell. 4 - 6: Indicate a Neutral. A value of 4 suggests that the trend might transition to a Sell, while a value of 6 suggests a transition to a Buy. 7 -10: indicate a Buy. A value of 7 represents the weakest Buy, while 10 represents the Strong Buy. More info at the link If you have any further questions or require additional assistance, please write to support@vfxalert.com

How to interpret trend indicator in vfxAlert auto trade settings

Image
Trend indicator predicts the market's likely direction for the next 10-15 bars based on the chosen timeframe. The Trend indicator of the vfxAlert will help you quickly assess the situation and find the moment for an option. How to trade with Trend read in vfxAlert blog . Here's how to interpret the vfxAlert signals provided by the Trend indicator: Green upward arrow: Indicates an upcoming uptrend. Red downward arrow: Indicates an upcoming downtrend. Yellow arrow pointing to the right: Suggests a sideways trend. A sideways trend is the horizontal price movement that occurs when the forces of supply and demand are nearly equal. Colored dots below the arrow represent the strength of the current trend. For auto trade settings indicator values range from 0 to 10 and have the following interpretations: 0 -3: Signify a downtrend. A value of 0 represents the strongest downtrend, while 3 represents the weakest. 4-6: Indicate a sideways trend. A value of 4 suggests a potential transiti